
OCMR Investment Perspectives 2.3
Beyond the Terminal Payoff Diagram: How the Industry Explains Buffered ETFs — and Why It Falls Short

Buffered ETFs have become one of the most successful product categories of the last several years. Advisors and clients are drawn to the promise of equity participation with a defined level of downside protection. Yet the way most of the industry explains these instruments still relies on a visual shorthand that is incomplete at best and misleading at worst.
The Industry Standard
Open almost any buffered ETF factsheet, brochure, or educational piece and you will see the same diagram: a clean payoff profile drawn at the end of the outcome period.
It typically shows a flat “buffer” zone on the downside, one-for-one participation up to a hard upside cap, and flat performance once the cap is reached. The diagram is elegant. It is also a terminal snapshot. It describes what the options package is engineered to deliver on the final day of the outcome period — after all remaining time value has decayed.
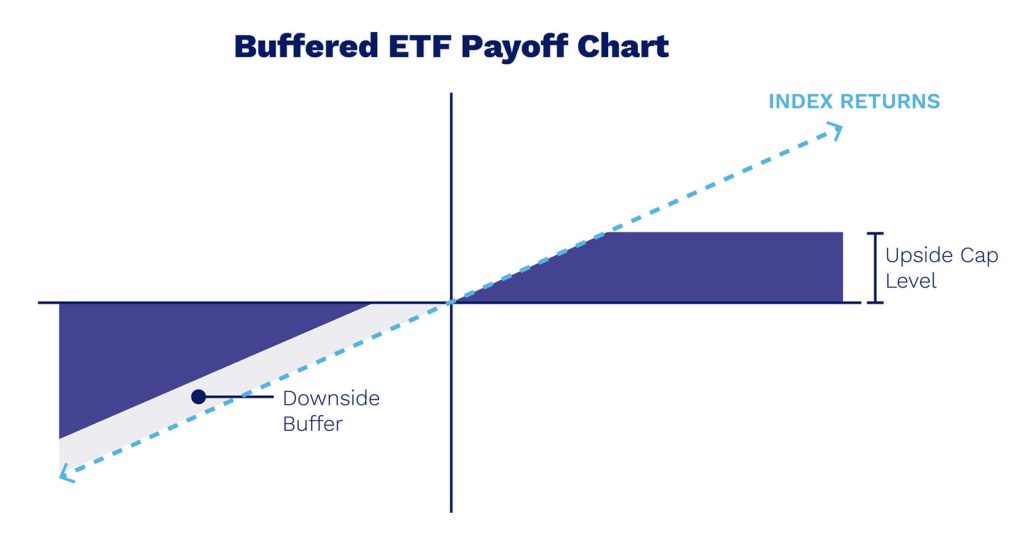
That is useful information. It is not a complete description of how the product behaves for the large majority of its life.
What the Terminal Diagram Obscures
Between reset dates, a buffered ETF is a living package of options. Its daily price is determined by remaining time to expiration, current implied volatility, the path the underlying has already taken, and the current distance to the buffer and cap strikes.
As a result, the mark-to-market value can (and frequently does) move in ways the terminal diagram does not capture. Investors can experience interim losses inside the stated buffer, muted upside even when the market is rising, and mild decay in flat markets. These are normal options economics. The problem arises when the industry’s dominant visual language makes those realities secondary or invisible.
A More Complete Picture
At BufferLabs we believe professional users deserve a clearer view of how these instruments actually price and evolve. Our individual ETF reports therefore include two elements that remain uncommon in the broader industry:
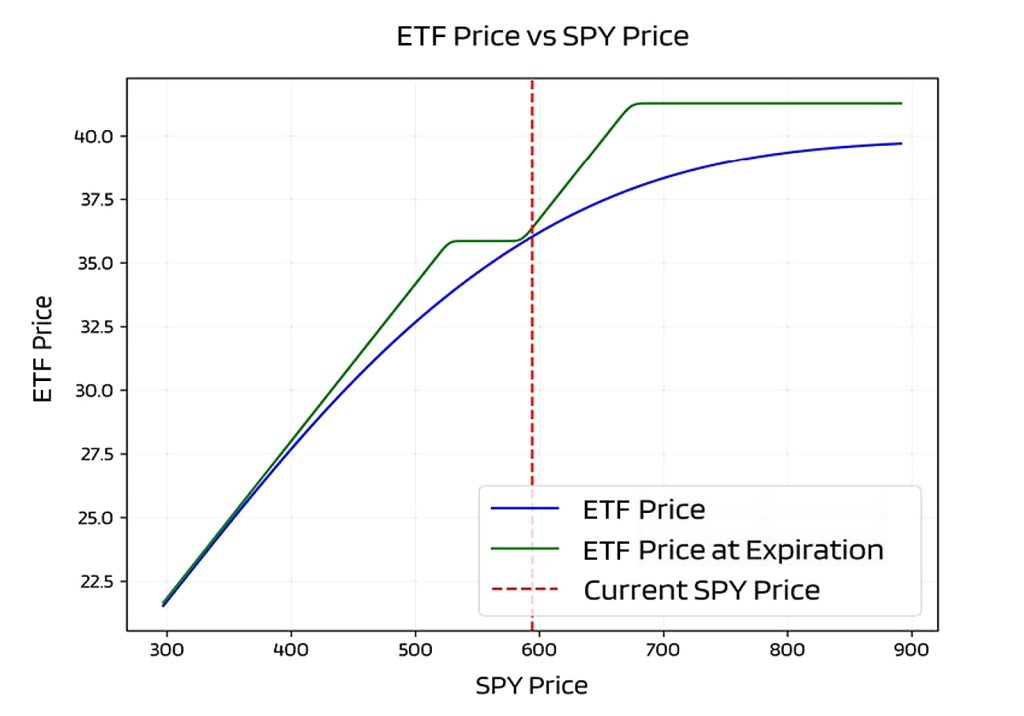
1. Dual-curve pricing graphs
We show the current (mark-to-market) price of the ETF across a range of underlying levels alongside the theoretical price at expiration. The gap between the two curves is the remaining optionality and time value.
2. Forward scenario tables
We publish 30-day, 60-day, and 90-day scenario tables that project expected ETF returns under a range of underlying market moves. These are model-based estimates grounded in current options pricing — not the final payoff diagram. They answer the practical question advisors actually face: “If the market moves X% from here over the next month or quarter, what should I reasonably expect from this position?”
Scenario Analysis
Days Until Options Holdings Expiration: 224
| SPY Scenario | ETF |
|---|---|
| Up 9% | +4.0% |
| Up 6% | +2.9% |
| Up 3% | +1.7% |
| Flat | +0.4% |
| Down 3% | -1.0% |
| Down 6% | -2.5% |
| Down 9% | -4.1% |
| SPY Scenario | ETF |
|---|---|
| Up 12% | +5.5% |
| Up 8% | +4.2% |
| Up 4% | +2.6% |
| Flat | +0.9% |
| Down 4% | -1.1% |
| Down 8% | -3.2% |
| Down 12% | -5.5% |
| SPY Scenario | ETF |
|---|---|
| Up 15% | +7.1% |
| Up 10% | +5.5% |
| Up 5% | +3.5% |
| Flat | +1.3% |
| Down 5% | -1.2% |
| Down 10% | -3.9% |
| Down 15% | -6.9% |
These scenario analysis tables are made available for the extra-curious members of our audience. The tables show possible moves in the underlying asset and the corresponding projected change in price of the buffered ETF. The projected price change of the buffered ETF is based on its holdings; for options contracts, these projections use the Black-Scholes options pricing model. Since the buffered ETF can trade at a premium or discount relative to its NAV and Black-Scholes requires us to make assumptions about the future, the projections will not be perfectly accurate, but they can be useful for comparing different buffers. When the moves or timeframes represented in these tables are exceeded, it is strongly recommended to consult our latest research. 'N/A' is shown when the scenario timeframe exceeds the days remaining until option expiration.
Why This Matters
Buffered ETFs are powerful risk-management tools when they are understood and managed as options-based strategies rather than as simplified “buffered equity” products. The terminal diagram remains a valid description of the contractual outcome. It should not, however, be the primary — or only — lens through which advisors evaluate, select, and monitor these holdings.
Greater transparency around interim pricing behavior does not diminish the value of buffered ETFs. It improves the odds that they will be used appropriately — with realistic expectations, better timing decisions, and clearer communication to clients.
That is the standard we aim for in our research.
Disclosures
This material is for informational and educational purposes only and does not constitute investment advice, a recommendation, or an offer to buy or sell any security. The views expressed are general in nature and are not tailored to any specific investor’s financial situation, objectives, or risk tolerance. Buffered ETFs involve risks, including loss of principal, and may not provide the intended buffer or cap outcomes if shares are bought or sold prior to the end of the outcome period. Outcomes are dependent on market conditions and the timing of investment relative to the ETF’s reset date. Any references to models, analytics, or probability assessments are based on assumptions and estimates that may not prove to be accurate. There is no guarantee that any model or analysis will achieve its intended results. Data is believed to be reliable but is not guaranteed as to accuracy or completeness. BufferLABS is a DBA of Ogard Capital Market Research LLC is an SEC registered investment advisor. Past performance is not indicative of future results.
Ogard Capital Market Research LLC, doing business as BufferLABS, offers investment advisory services that include a buffered ETF strategy. The firm and its affiliates therefore have a financial interest in promoting the broader use and understanding of buffered ETFs as an investment category. This material should not be viewed as a recommendation to invest in any particular buffered ETF, including any strategy managed or advised by BufferLABS.
Comments