The Market Went Down! Why did my buffered position go down at all? I thought it was hedged!
When it comes to Buffered ETFs, there are many misconceptions held by investors about their structures and payoff features that can lead to unrealistic expectations and, unfortunately, some disappointment in their returns. These things become prominent when the market goes through a period of heightened volatility, like the one we are in at present. We think this disappointment stems from a lack of understanding of how these instruments are constructed and how they behave.
We at BufferLABS are here to shed light on these very important hedging instruments to enlighten people of their characteristics, structures, and performance behavior. Our research will bring understanding and help investors develop better expectations about the types of returns they should expect from their buffered ETF holdings. This will lead to a “no surprises” experience with respect to your buffered ETF holdings and will create happier clients in the process.
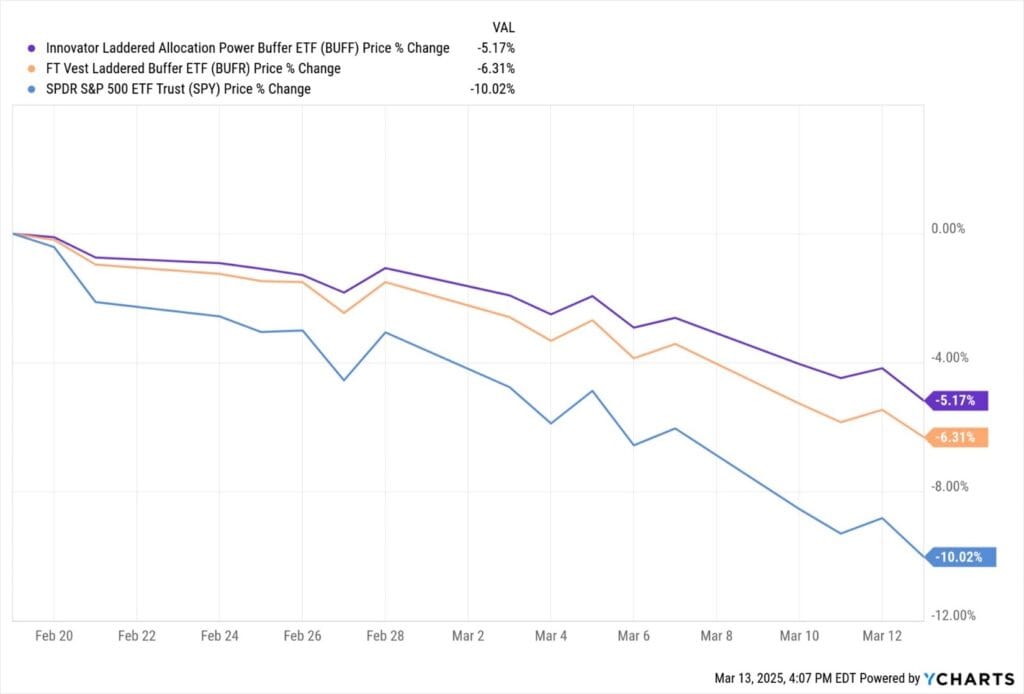
By way of example, let’s look at the range of returns we have seen from buffered ETFs since the market peaked on February 19th, 2025, and through Thursday, March 13, 2025. Let’s start with First Trust’s laddered buffered ETF strategy BUFR and Innovator’s laddered buffered ETF strategy BUFF. We see first below that these two laddered products indeed provide downside protection as advertised. Since the downturn started on February 19th, the SPY ETF is down -10.02% while BUFR is down -6.31% and BUFF is down -5.17%. In both cases, this is decent downside protection.
But what would be the investor experience if they held a small sample of the individual ETFs held in BUFR or BUFF? We can see below that the performance difference between the best performing ETF and the worst within the BUFR ladder is a full 283 basis points! And the difference between the best and the worst in BUFF is 294 basis points! The spread between the best performing BUFF holding and the worst performing BUFR holding is a whopping 370 basis points! Why did this happen? Is it random? Or can an analytical system shed light on these differences?
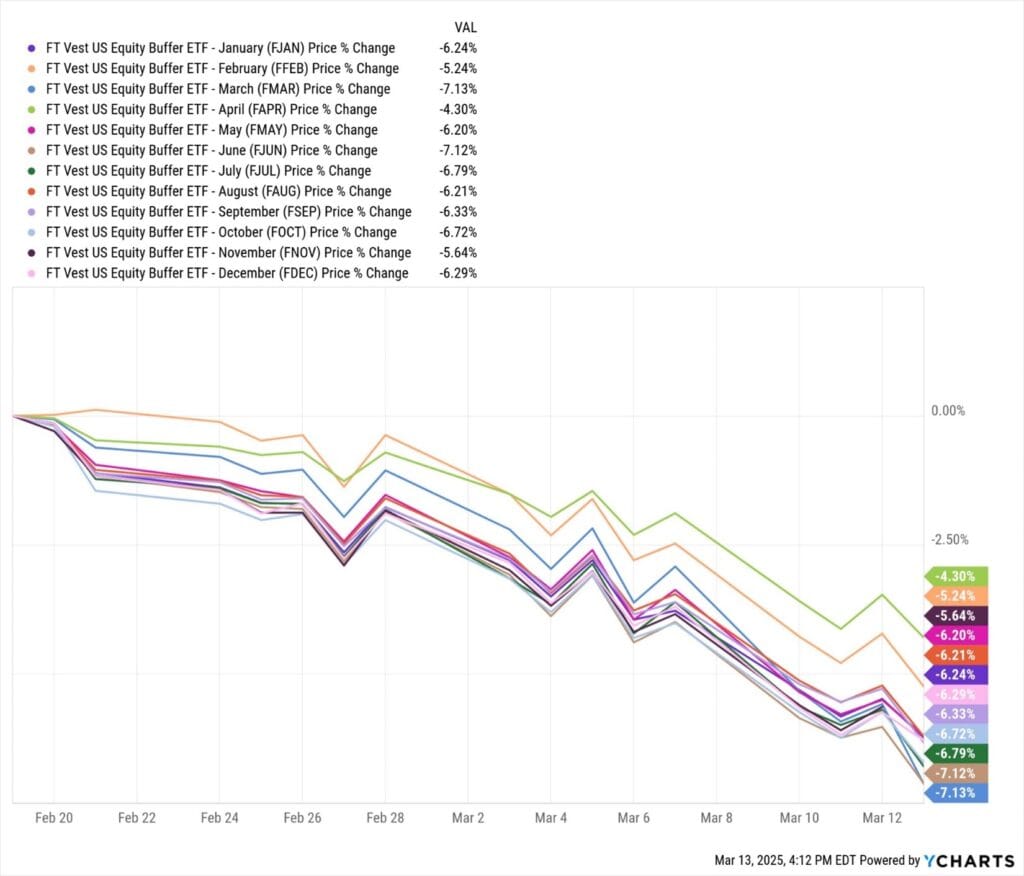
The BufferLABS proprietary ADOPT model can help show you why these disparities exist and point you in the direction of better ones for either upward or downward market moves. We can see in the charts above that the best performing ETF inside First Trust’s BUFR was FAPR, down -4.30% while the worst, FJUN, was down -7.12%. For Innovator’s BUFF, the best performer PMAY was down -3.43%, while the worst performer PAPR was down -6.37%. The question is, was it possible to model the drivers of these performance differences BEFORE the move?
At BufferLABS, we’ve created lots of analytical tools and frameworks for peering into the underlying options positions to gather a sense of what these specific instruments will do in specific scenarios. For example, on February 21st, our research report showed the following 30-day scenarios for the two First Trust ETFs in question (FAPR and FJUN):
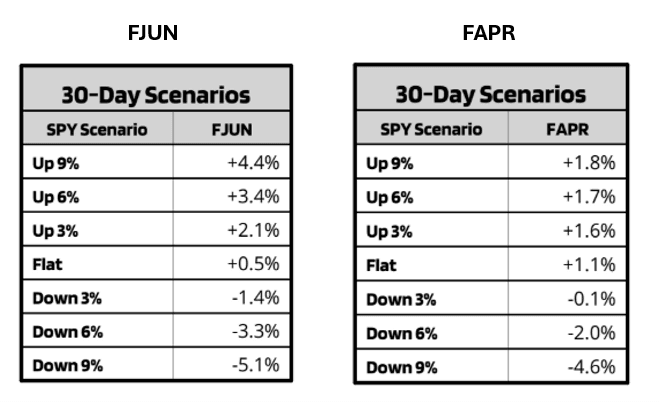
In a down 10% market, we knew in advance that FJUN (-7.12%) would be down more than FAPR (-4.3%). In this instance, FJUN did worse than represented in the scenario tables, while FAPR did a little better. The reasons are highly nuanced related to the pricing of options, and the factors involved in options pricing like time, volatility pricing, and changes in volatility. But if investors knew in advance of these potential moves, they would have known full protection of the downside move was not possible with these instruments.
Now let’s look at the Innovator positions.
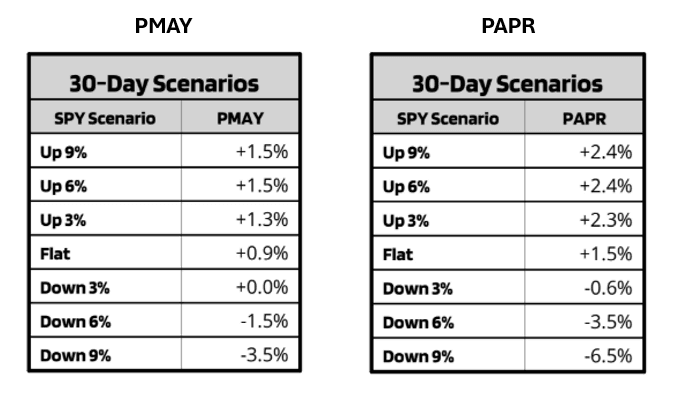
As with the First Trust ETFs, the ADOPT model knew in advance that a down 10% market would result in PMAY (-3.43%) doing much better than PAPR (-6.37). In this case, the outcomes specified by the scenario tool on February 21st ended up being very close to what transpired in markets in the ensuing three weeks─in terms of both magnitude and direction.
The primary point is that users of BufferLABS' research would know in advance how these specific instruments were likely to behave in a down 10% market. Thus, clients would have been comfortable the ETFs provided exactly the kind of return they should have expected from these instruments in a market that went down 10% in three weeks.
BufferLABS research will help you and your clients establish realistic expectations from your Buffered ETF positions for all kinds of market scenarios over different periods of time, which will lead to more knowledgeable and satisfied clients, and help you retain them in challenging market environments.
Comments