Why the Industry Needs a Buffered ETF Benchmark and Why We Created the BufferLabs 100© Index
The exchange-traded fund (ETF) landscape has evolved dramatically over the past decade, with one of the most exciting innovations being the rise of buffered ETFs—also known as defined outcome ETFs. These funds, which use options strategies to provide downside protection while capping upside potential, have surged in popularity, growing from a niche concept in 2018 to a category managing over $60 billion in assets today. Yet, despite their rapid adoption, the industry lacks a standardized benchmark to evaluate their performance. That’s a gap we aim to fill with the BufferLabs 100© Buffered ETF Index. Here’s why this benchmark is overdue and how our index addresses the need.
The Case for a Buffered ETF Benchmark
Buffered ETFs occupy a unique space in the investment world. They’re not traditional equity ETFs chasing uncapped market returns, nor are they fixed-income proxies offering guaranteed safety. Instead, they blend equity exposure with risk management, appealing to investors who want S&P 500 participation without the full sting of a downturn. This hybrid nature makes them tricky to assess using existing benchmarks like the S&P 500 or Bloomberg U.S. Aggregate Bond Index. Comparing a buffered ETF to the S&P 500, for instance, ignores the fund’s built-in downside buffer—its defining feature. Likewise, pitting it against a bond index overlooks its S&P 500-linked upside potential.
Without a tailored benchmark, investors and advisors are left navigating a patchwork of performance metrics. Some judge buffered ETFs against broad equity indices, which overstates their risk and underplays their protective qualities. Others use custom blends of stocks and bonds, but these vary widely and lack consistency. The result? A fragmented understanding of how these ETFs perform, both individually and as a category. This confusion hampers adoption, as financial professionals and retail investors struggle to contextualize returns, assess value, and integrate buffered ETFs into portfolios effectively.
The industry needs a unified standard—a yardstick that reflects the risk-reward profile of buffered ETFs. A dedicated benchmark provides clarity, enabling apples-to-apples comparisons across funds, issuers, and strategies. It also legitimizes the category, signaling to skeptics that buffered ETFs are a serious, measurable asset class, not just a trendy experiment. As assets pour into these funds—driven by volatile markets, low bond yields, and demand for alternatives—standardization becomes not just useful, but essential.
Enter the BufferLabs 100© Index
That’s where the BufferLabs 100© Buffered ETF Index comes in. We created this index to meet the industry’s need for a comprehensive, transparent benchmark tailored to S&P 500 buffered ETFs. Our goal was simple: design a tool that captures the essence of these funds—downside protection paired with capped upside—while offering a consistent reference point for performance evaluation.
The BufferLabs 100© tracks the 100 largest S&P 500 buffered ETFs by assets under management, spanning multiple issuers, S&P 500 strategies (with buffers ranging from 9% to 100%), and reset periods. By aggregating these funds into a single index, we’ve built a broad representation of the category, smoothing out idiosyncrasies like reset dates or cap variations that can skew individual fund results. The index is equally weighted, rebalanced monthly, and adheres to the principles of being rules-based, transparent, investable, and replicable, ensuring it remains a practical and reliable tool for the market.
Why 100? It’s a balance of breadth and focus. With over 300 buffered ETFs now available, a smaller sample might miss key trends, while including every fund could dilute the index’s utility with thinly traded or niche products. The top 100 captures the core of the S&P 500 market—think of it as the “large-cap” universe of buffered ETFs—offering a practical snapshot for investors and analysts alike.
Why We Created It
We launched the BufferLabs 100© because we saw an opportunity to move the conversation forward. S&P 500 buffered ETFs are no longer a sideshow; they’re a mainstay for advisors managing client risk and retirees seeking growth without sleepless nights. Yet, without a benchmark, the industry risked stunting their potential. Advisors need a way to justify allocations, portfolio managers need a performance target, and investors need confidence that these funds deliver as promised. The BufferLabs 100© aims to provide all three.
Our index also addresses a practical challenge: timing risk. S&P 500 buffered ETFs often have fixed outcome periods (e.g., one year), and their returns hinge on when an investor enters or exits. By pooling 100 funds with staggered resets—monthly, quarterly, or annually—the BufferLabs 100© mitigates this “vintage” effect, offering a smoother, more representative return profile. It’s not about picking winners; it’s about understanding the category as a whole.
Finally, we wanted to spark innovation. A benchmark isn’t just a measuring stick—it’s a catalyst. By establishing the BufferLabs 100©, we’re challenging issuers to refine their strategies, compete on performance, and push the boundaries of what S&P 500 buffered ETFs can achieve. It’s a signal to the market: this category matters, and it’s time to treat it with the rigor it deserves.
Looking Ahead
The S&P 500 buffered ETF space is still young, but its trajectory is clear. As markets remain unpredictable and traditional hedges like bonds lose their luster, investors will keep turning to these funds for balance. The BufferLabs 100© Index is our contribution to that future—a tool to bring clarity, credibility, and confidence to a growing corner of the ETF universe. Whether you’re an advisor building portfolios, an investor weighing options, or an issuer designing the next big fund, we believe this benchmark can help you navigate the path ahead.
Stay tuned as we roll out more insights from the BufferLabs 100©—performance trends, risk metrics, and practical applications. The S&P 500 buffered ETF story is just beginning, and we’re excited to help write the next chapter.
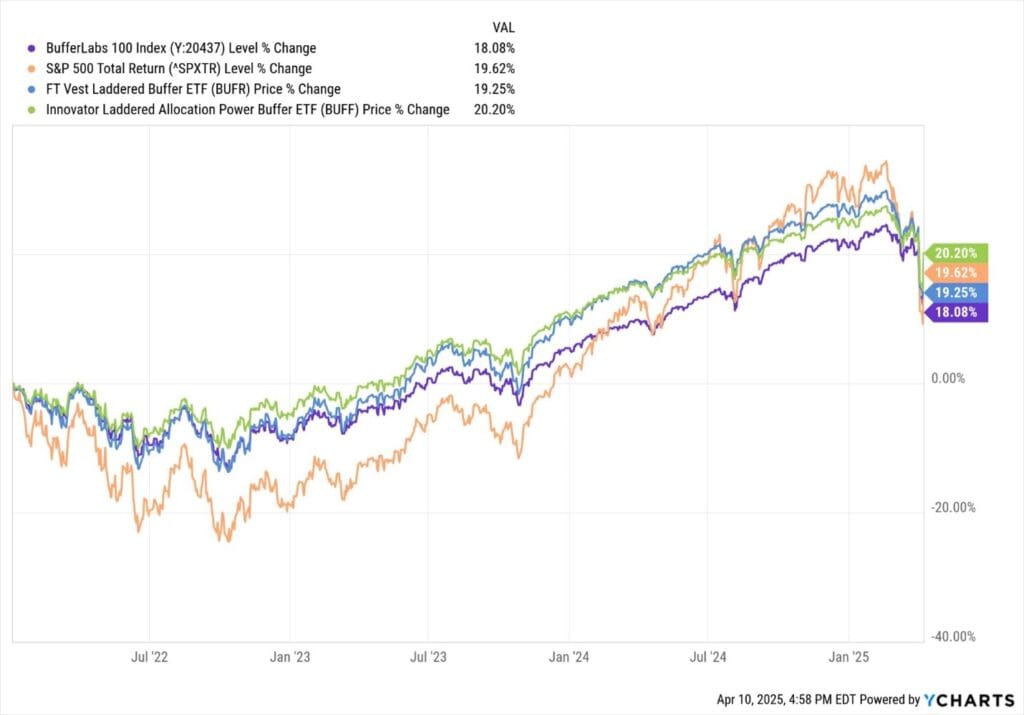
Below is a chart of the BufferLabs 100© Index. This chart covers January 2022 through April 9, 2025. For detailed holdings and access to the return files, please subscribe to the Pro level subscription or contact us for individual pricing quotes.
Comments